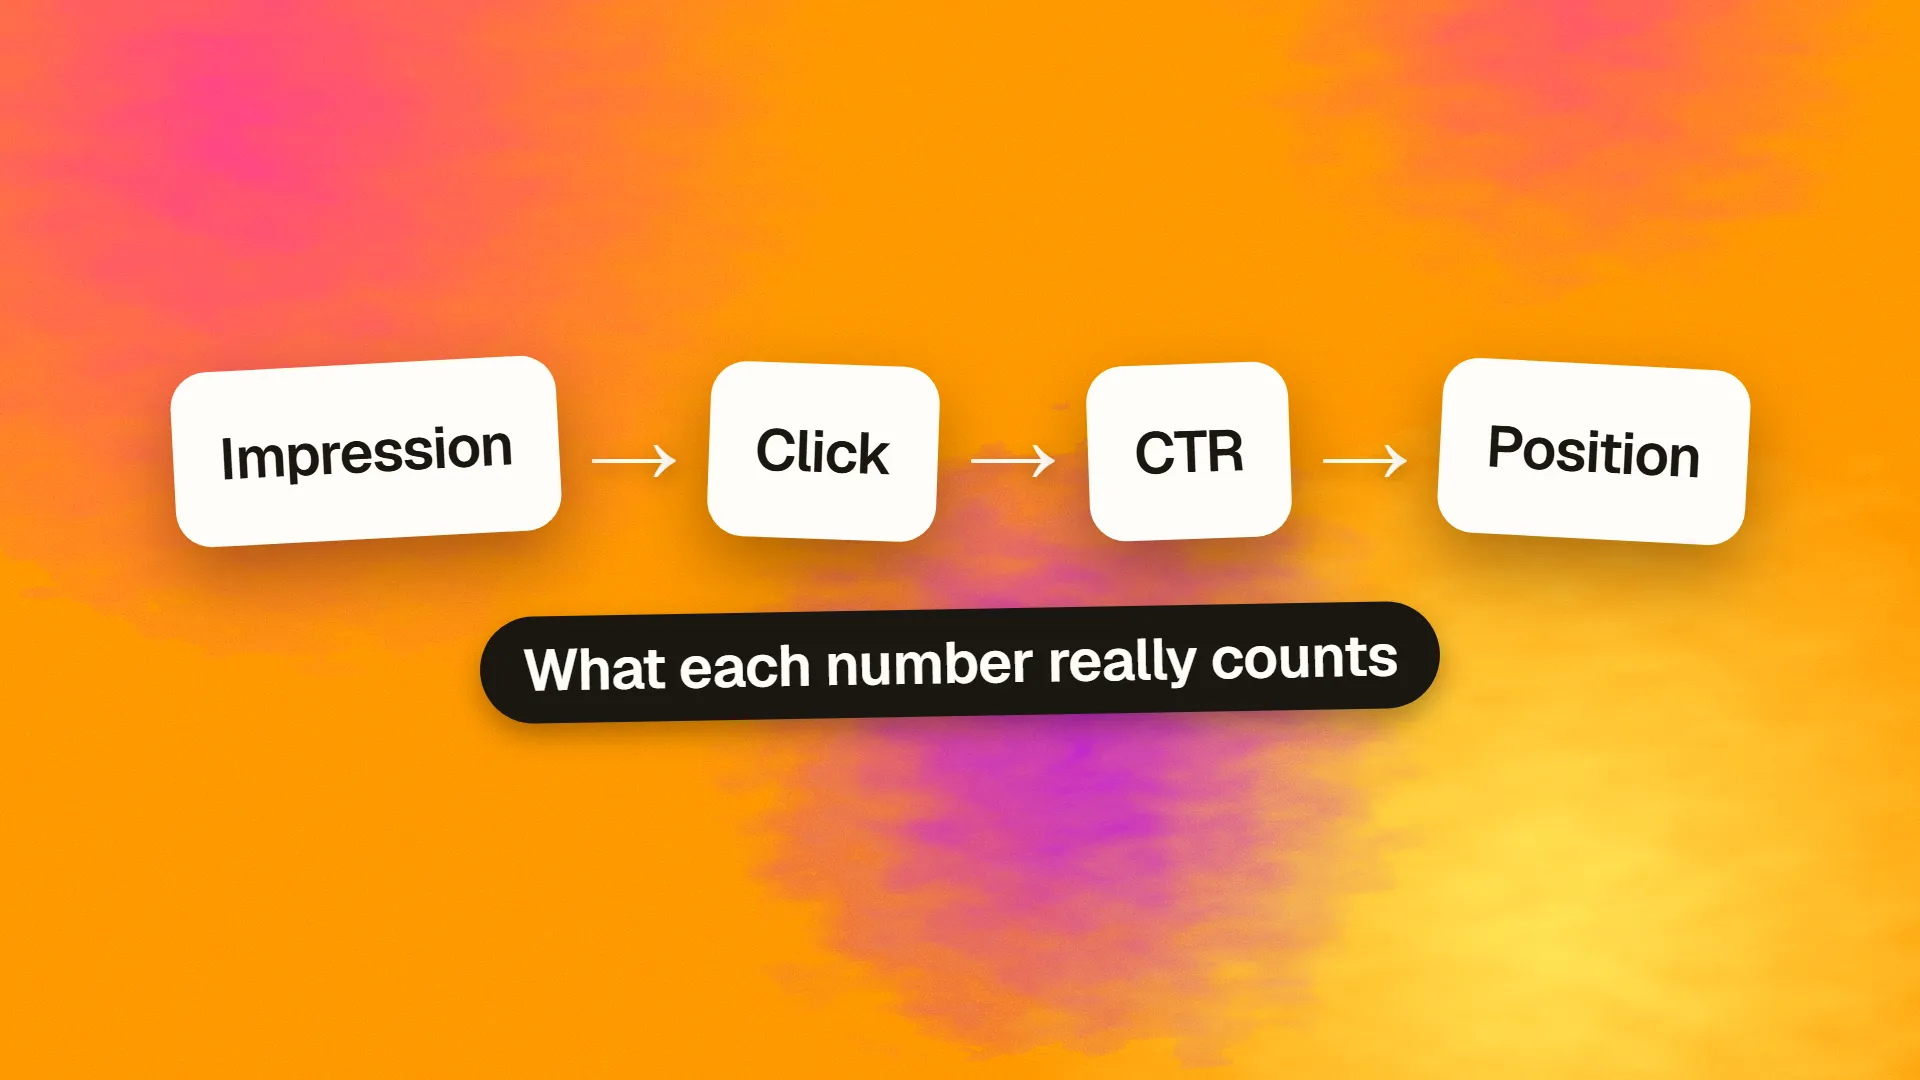
In short
In Search Console, an impression is counted when a link to your site appears in a results page a user saw, whether or not they scrolled to it; a click is a user following that link; click-through rate is clicks divided by impressions; and average position is the mean of your highest ranking position on each results page where you appeared. The totals are dominated by high-impression queries and the position is averaged across everything, so a new page ranking at position 40 for many queries lowers the average while improving the site. Read the metrics filtered by query, page and date, never as site-wide totals.
The definitions
Impression. Counted when a link to your site appears in a search results page that a user viewed, on the page they were on, whether or not the link was scrolled into view. On the first page of ten results, ranking anywhere on it counts as an impression for each search. On infinitely scrolling mobile results, an impression is counted when the section containing your link is loaded. One search can produce one impression for your site regardless of how many of your pages appear, in the site-level count, but one per page in the page-level count.
Click. A user clicking a link to your site from the results. Clicks are counted once per search even if the user clicks the same result twice. Clicks on ads, images in image search and other surfaces are reported under their own search types.
Click-through rate. Clicks divided by impressions, for whatever set the report is filtered to.
Position. For each search, the position of your highest-ranking link on the results page, counting features such as featured snippets and image blocks as positions. Average position is the mean of those per-search positions over the filtered set.
These are precise, and each has a consequence that catches people.
Why the totals mislead
The headline numbers aggregate everything: every query, every page, every country and device. A handful of high-impression queries, often brand terms or one viral page, dominate them. A site's total impressions can rise sharply because it started appearing at position 50 for a broad term, with no change in clicks; or fall because a single page dropped, while everything else improved.
The click-through rate total mixes brand queries at 60% with informational queries at 2%, and a shift in the mix changes the total with no change in any page's performance. Nothing decision-relevant lives in the totals. Every useful reading is filtered.
The average-position paradox
Average position falls, meaning worsens, when a site improves in a way it does not expect. Publish a new page that ranks at position 35 for two hundred queries: the site now has two hundred more impressions at a poor position, and the average across all queries drops even though every existing ranking is unchanged and the new page is a gain. Conversely, losing a page that ranked at 40 for many queries improves the average.
The average is also of highest positions per search, so a page that ranks 3 and 8 for a query counts as 3, and a site appearing in a featured snippet at position 1 and an organic result at 5 counts as 1. Compare average position only for the same query or page over time, never across sets of different composition, and treat a falling average with rising impressions as probably good news until the query breakdown says otherwise.
Page and query aggregation
The Pages tab and the Queries tab aggregate differently. In the Pages tab, impressions are per page, so a search where two of your pages appear counts twice. In the Queries tab, and in the site total, that search counts once. The two tabs therefore do not sum to the same number, and comparing a page's impressions with the site total is comparing different units.
The most useful view combines them: filter to one page and read its queries, which shows what that page ranks for and where; or filter to one query and read its pages, which shows which page Google chose and whether several compete.
Sampling and privacy limits
The interface shows up to a thousand rows per report, and the exported data omits queries Google classifies as rare or privacy-sensitive, so the query rows do not sum to the total impressions; the difference is the anonymised long tail, often a large share. The API returns more rows and the bulk export to BigQuery returns nearly everything, which matters for large sites. Data lags by a day or two and is retained for sixteen months, so year-on-year comparison is possible and anything older is gone unless exported.
A reading method
- Set the date range to a period long enough to smooth weekly patterns, at least 28 days, and compare with the same period before.
- Exclude brand queries with a filter, so the numbers describe discovery rather than recognition.
- Read by query first: which queries gained or lost impressions and clicks, sorted by the change. This is where the story is.
- Then by page: which pages carry the change, and whether a page's queries shifted toward or away from its intent.
- Check position per query, not on average, for the queries that matter.
- Look for high impressions with low CTR at good positions, which are snippet problems worth fixing, and high impressions at poor positions, which are pages nearly ranking and worth strengthening.
- Segment by device and country when the totals disagree with the story.
The report is a diagnostic instrument, and it answers specific questions well; it answers "how is the site doing" badly, because that is not a specific question. If you would like a Search Console review that turns the report into a prioritised list, book a call; it is a few hours with the filters.
Common questions
What is an impression in Google Search Console?
A count of each time a link to your site appeared on a results page that a user viewed, whether or not they scrolled to it, on the page of results they were on. One search counts as one impression for the site regardless of how many of your pages appeared, and as one per page in the page-level report.
Why did my average position go down when I published new content?
Because average position is the mean of your best position across every search where you appeared, and a new page ranking at position 30 or 40 for many queries adds lots of low positions to the average without changing existing rankings. Rising impressions with a falling average usually means the site is appearing for more queries, which is good; check position per query.
Why do the query rows not add up to the total impressions?
Because Search Console omits queries it classifies as rare or privacy-sensitive from the query list while still counting them in totals, and the interface shows at most a thousand rows. The gap is the anonymised long tail, often a large share. The API and the BigQuery bulk export return more of it.
What is a good CTR in Search Console?
It depends on position and query type: around 25–35% at position one for non-brand queries, falling to a few percent by position five to ten, higher for brand queries, lower where SERP features and AI Overviews take clicks. Judge a page's CTR against your own pages at the same position, filtered to exclude brand queries, rather than against the site total.
How far back does Search Console data go?
Sixteen months, with a lag of a day or two. Year-on-year comparisons are possible within that window; anything older is lost unless you export it, which the API and the BigQuery bulk export allow. Set up an export early if you want history beyond sixteen months.