In short
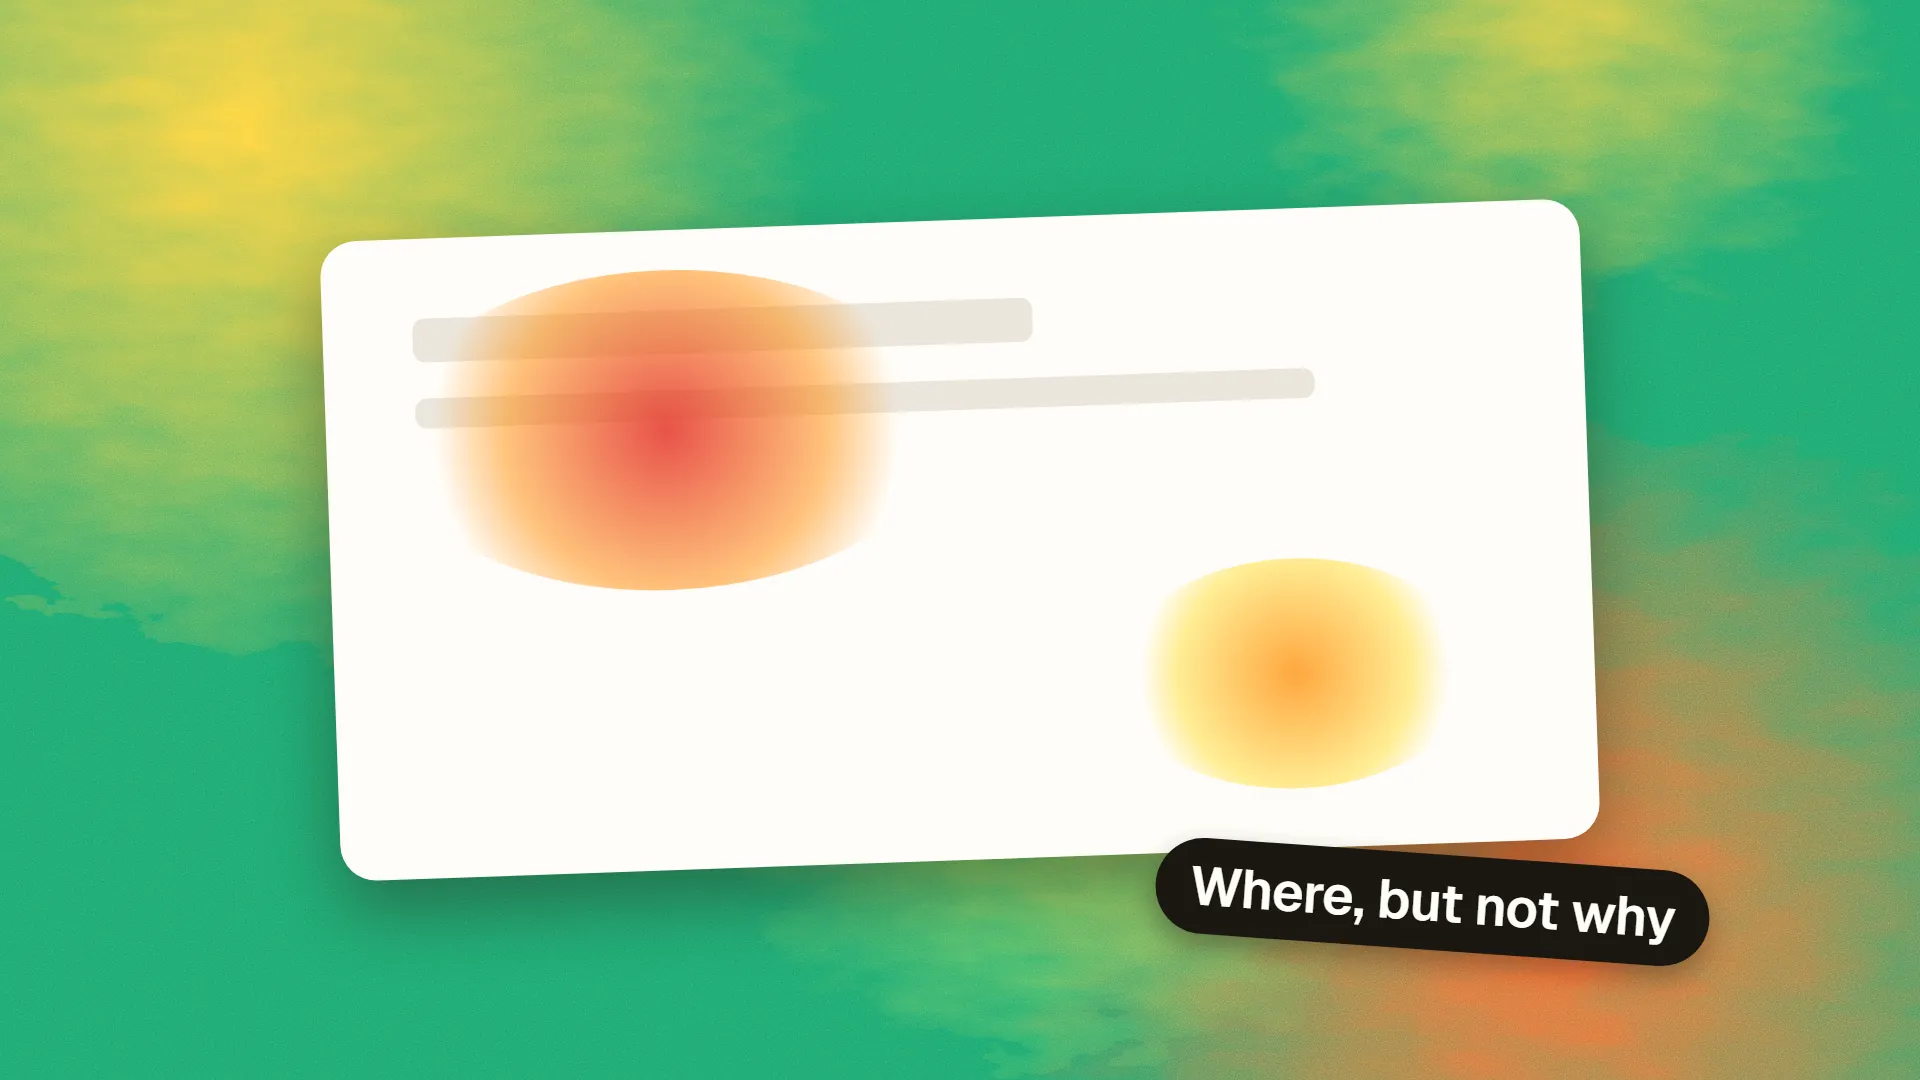
A website heatmap is a visual overlay that aggregates visitor interactions on a page: click maps show where people click or tap, move maps show where the cursor travels, and scroll maps show how far down the page each proportion of visitors reached. They are good at exposing three things: elements people try to click that are not clickable, content that sits below where most visitors stop scrolling, and attention going to the wrong place. They cannot tell you why any of it happens, they need a few thousand views to be trustworthy, and a page that reflows by screen size needs a separate map per breakpoint.
What a heatmap is
A heatmap tool records where visitors interact with a page, aggregates those interactions across many sessions, and renders them as a colour overlay on a screenshot. Warm colours mark the areas with the most activity; cool colours or nothing at all mark the areas with the least. Hotjar, Microsoft Clarity, Mouseflow and Crazy Egg all produce them, and Clarity is free, which is why heatmaps have become the first behavioural analytics most small sites ever see.
The word covers three distinct maps, and the confusion between them causes most of the bad conclusions.
The three types
Click maps plot every click or tap. On desktop they are precise; on mobile they record taps, which is the same thing. They answer: what are people trying to do on this page?
Move maps plot cursor position over time, on the theory that where the mouse goes, the eyes go. That correlation is real but loose, and the map is meaningless on touch devices, which have no cursor. Treat move maps as a rough attention proxy for desktop visitors only.
Scroll maps colour the page by how many visitors saw each vertical position. The top is always 100 per cent; the colour cools as you go down, and the tool usually marks the point where half of visitors had stopped. They answer: how much of this page does anyone read?
| Map | Records | Trust it for | Ignore it for |
|---|---|---|---|
| Click | Clicks and taps | Intent, dead clicks, competing links | Reading behaviour |
| Move | Cursor position | Rough desktop attention | Mobile, precise reading |
| Scroll | Viewport depth | Content placement, page length | Whether anything was read |
What a heatmap genuinely tells you
Dead clicks. The single most valuable finding. A cluster of clicks on a heading, an image, an icon or a piece of styled text that is not a link means visitors expect it to do something. Either make it do that thing or restyle it so it stops looking interactive. This is invisible in ordinary analytics because nothing happens when the click lands.
Rage clicks. Repeated rapid clicks in one spot. Sometimes a dead element, sometimes a button that is slow to respond, sometimes a form that rejects input without saying why. Clarity flags these automatically.
Where attention stops. If your scroll map shows that 30 per cent of visitors reach the pricing section and the call to action sits below it, you have a placement problem, not a copy problem. The fix is structural.
Competition between links. A navigation bar with seven items where two receive nearly all the clicks is telling you what the page is for. That is useful input for the next navigation menu review.
What it does not tell you
A heatmap shows what happened and never why. A cold call to action might be poorly placed, poorly worded, or simply not what the visitor came for. The map cannot distinguish those. To find out, pair it with session recordings, which show individual visits in motion, or with a short exit survey.
It also does not tell you whether anyone read the content they scrolled past. A visitor scrolling quickly to the footer to find a phone number lights up the whole scroll map without reading a word. Combine scroll depth with time on page, or with the engagement events in your analytics, before concluding that a section works.
The traps
Small samples. A heatmap of 80 visits is a picture of 80 people, several of whom were probably you. Most tools will draw a convincing image from any number. Wait for a few thousand views on the page before reading it, and more if the page has several distinct audiences.
Mixed devices. A page reflows between desktop and mobile, so a click at a given pixel position means different things on each. Every serious tool separates maps by device type; use that filter, always, and never read a combined map.
Dynamic content. Sliders, tabs, accordions and personalised blocks mean the screenshot the tool captured may not be what a given visitor saw. Clicks land on the wrong element in the overlay. Tools handle this with varying success; if a page has a lot of state, prefer recordings.
The false fold. Scroll maps show a sharp drop at the first screen height because some visitors leave immediately. That is bounce, not a statement about where the fold is. The fold itself varies by device and is a weaker constraint than the map makes it look.
Confirmation. Heatmaps are so visual that people find in them whatever they already believed. Write down what you expect to see before you open one.
Turning a map into a change
A useful heatmap review is short and produces a list, not a mood. Look for dead clicks and rage clicks first, because those are defects with obvious fixes. Then check whether the primary call to action sits above the point where half your visitors stop. Then check whether the clicks the page receives are the ones it was designed for. Each finding becomes a hypothesis, and the hypothesis becomes a change you can test, or at least measure before and after with conversion rate as the outcome.
Heatmap tools are cheap, but they are a script on every page, and the free ones pay for themselves with data. Check what the tool collects, add it to your privacy notice, and mask form fields so that recordings never capture what visitors type.
If you would like an outside read of what your heatmaps and recordings are showing, book a call.
Common questions
What is the difference between a heatmap and a click map?
A click map is one type of heatmap. The term heatmap covers click maps, move maps (cursor position) and scroll maps (how far visitors reached). When someone says heatmap without qualification they usually mean the click map.
How many visitors do you need for a reliable heatmap?
There is no fixed number, but a few thousand page views per device type is a sensible minimum. Below that, a handful of unusual sessions can dominate the picture. Always filter by device, since desktop and mobile layouts differ.
Are heatmaps accurate on mobile?
Click (tap) maps and scroll maps are accurate on mobile. Move maps are not, because touch devices have no cursor to track. Read mobile maps separately from desktop ones.
Do heatmap tools slow down a website?
They add a script, typically loaded asynchronously, and the effect on load time is usually small. The larger cost is privacy: session recordings can capture typed input unless fields are masked, so configure masking and update your privacy notice.
Which heatmap tool is free?
Microsoft Clarity is free without traffic limits and includes heatmaps, recordings and rage-click detection. Hotjar has a limited free tier. Both require adding a script to every page.