In short
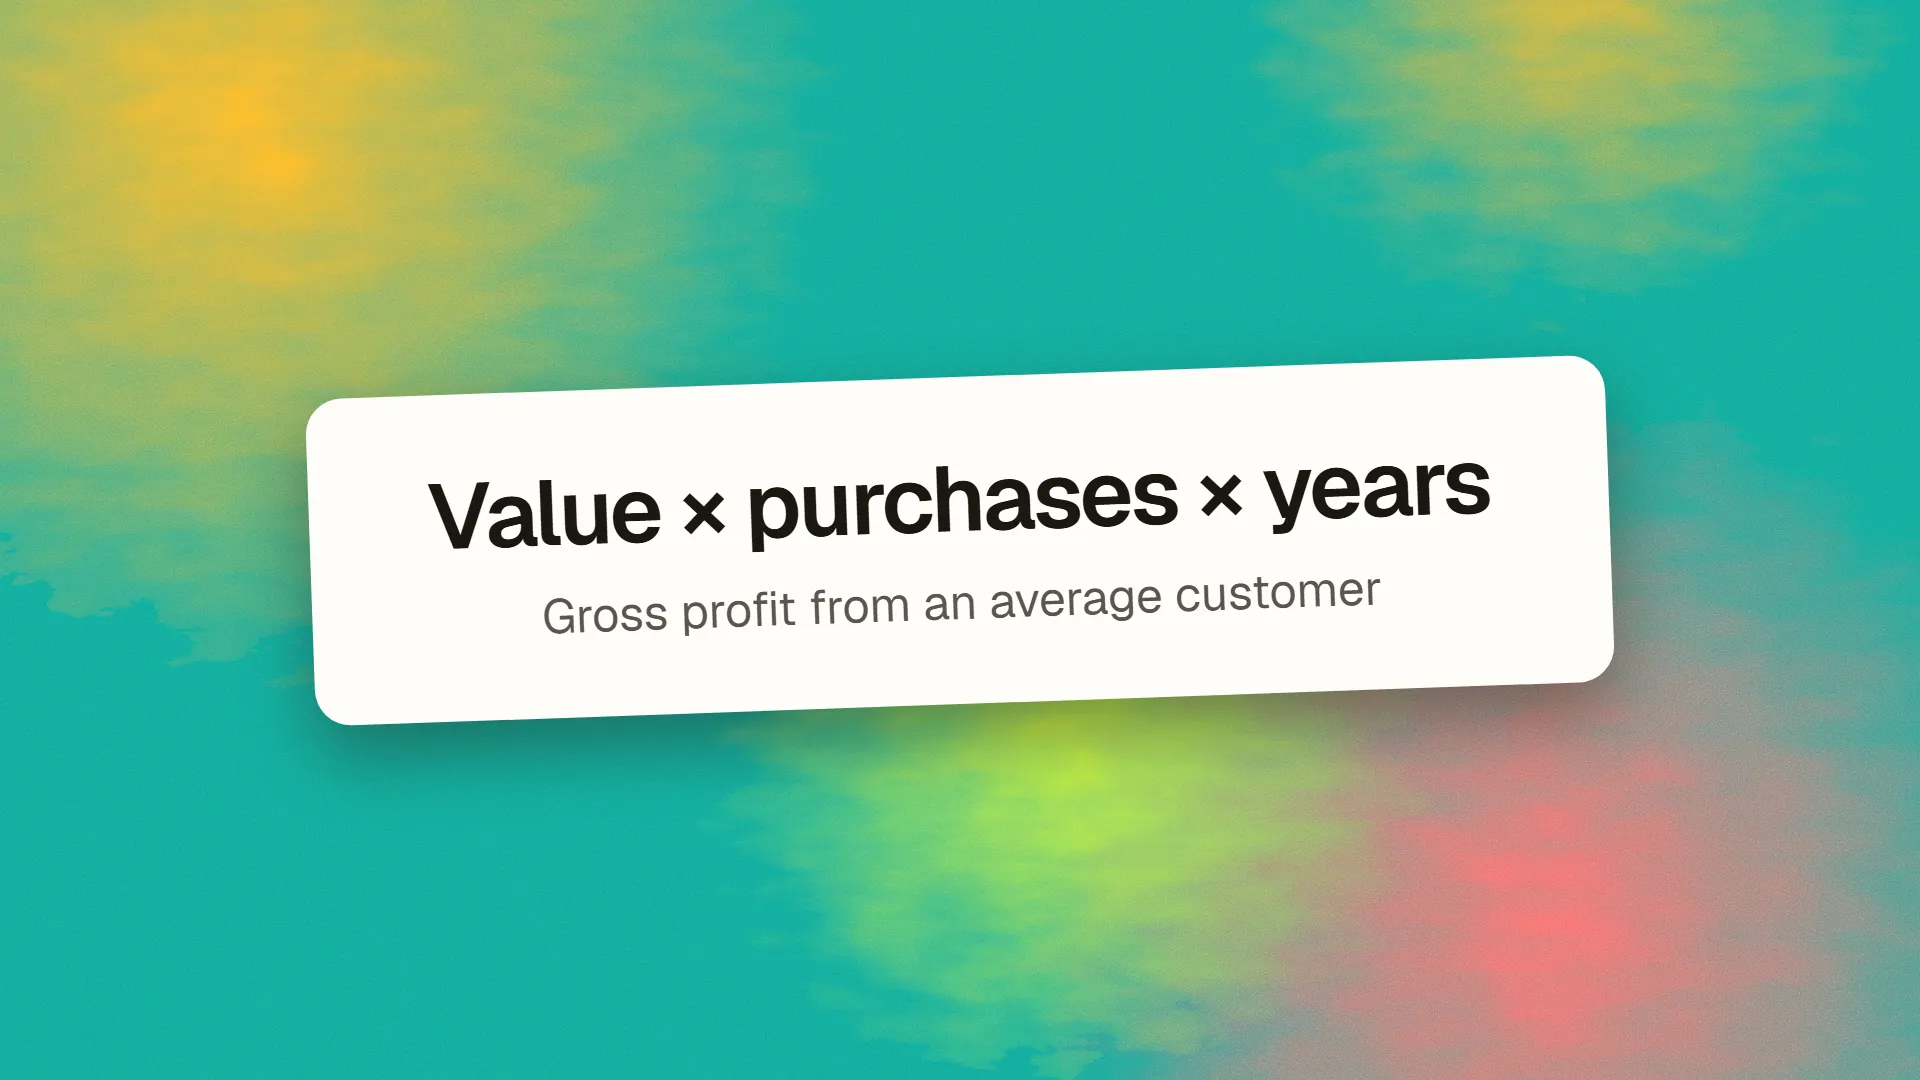
Customer lifetime value is the total gross profit a business expects from an average customer over the entire period they remain a customer. The simple estimate is average order value multiplied by purchases per year multiplied by the number of years a customer stays, all multiplied by gross margin; for subscriptions it is monthly margin per customer divided by monthly churn rate. It matters because it sets the ceiling on what you can spend to acquire a customer: a common benchmark is a lifetime value at least three times acquisition cost, with the cost recovered within about a year.
The definition
Customer lifetime value, abbreviated CLV or LTV, is the total value a customer produces over the whole of their relationship with a business, from the first purchase to the last. Value should mean gross profit, not revenue: a customer who spends £10,000 on goods with a 20 per cent margin is worth £2,000, and treating them as worth £10,000 is the most common way the number is inflated.
It exists as a metric because acquiring a customer costs money, and the only way to know whether that money was well spent is to know what the customer will be worth in return. Customer acquisition cost is the other half of the pair.
The simple formula
For businesses with repeat purchases:
CLV = average order value x orders per year x years retained x gross marginA café customer spending £6 per visit, twice a week, for two years, at a 65 per cent margin, is worth roughly £6 x 104 x 2 x 0.65 = £811. A consultancy client paying £4,000 per project, one project a year, for three years, at a 50 per cent margin, is worth £6,000.
For subscriptions, where customers pay regularly until they cancel, the formula uses churn:
CLV = monthly gross margin per customer / monthly churn rateA software product earning £40 of margin per customer per month with 3 per cent monthly churn gives a lifetime value of £40 / 0.03 = £1,333, because 1 / churn is the expected number of months a customer stays. Churn is therefore the single largest lever on subscription CLV: halving it doubles the number.
| Business type | Formula | Key input |
|---|---|---|
| Repeat retail or services | Order value x frequency x years x margin | How long customers stay |
| Subscription | Monthly margin / monthly churn | Churn rate |
| One-off purchase | Order margin plus referrals | Referral rate |
The traps
Averages hide segments. An average CLV blended across a few large accounts and many small ones describes no real customer. Split by segment, channel or plan; the difference between the best and worst segment is usually the most useful thing the calculation reveals.
Survivorship. Working out retention from the customers you currently have over-counts the loyal ones, because the ones who left are not in the sample. Use a cohort: everyone who joined in a given month, and what proportion of them remained after 3, 6, 12 and 24 months.
Optimism about lifespan. A business two years old cannot know that customers stay for five. Cap the horizon at what the data supports, or discount future years, and revisit as history accumulates. A projected CLV is a forecast and should be labelled as one.
Revenue instead of margin. Already mentioned, and worth repeating: a CLV quoted in revenue makes every acquisition channel look affordable.
Ignoring the cost to serve. Support, account management and retention marketing all reduce what a customer is worth. Gross margin captures cost of goods but not these; for a service business they can be substantial.
Using it
CLV becomes a decision tool when set against acquisition cost.
The ratio. CLV divided by CAC. A common benchmark is at least 3:1: a customer worth three times what they cost to win. Below 1:1 the business loses money on every customer and growth makes it worse. Far above 3:1 sometimes signals under-investment in acquisition rather than health.
Payback. The months of gross margin needed to recover CAC. A £300 CAC against £40 of monthly margin pays back in seven and a half months. Payback under twelve months is comfortable; beyond eighteen, growth consumes cash and the recovery depends on customers surviving longer than cohorts may show.
Channel budgets. If customers from search have a higher CLV than customers from paid social, as they often do because they arrived with intent rather than being interrupted, then the funnel arithmetic changes: a channel with a higher CAC can still be the better one.
The ceiling on spend. The most practical use. If a customer is worth £1,333 and you want a 3:1 ratio, you can spend up to £444 to win one. That figure tells the marketing team what a lead is worth, what an ad can cost, and whether a proposed conversion improvement is worth the fee.
Raising it
CLV has four inputs and each one is a lever. Raise the order value (bundles, tiers, a well-designed pricing page). Raise the frequency (reminders, subscriptions, a reason to return). Extend the lifespan (onboarding that gets customers to value quickly, support that answers, a product that keeps working). Protect the margin (pricing discipline, cost control). For most businesses the lifespan lever is the largest and the least worked, because acquisition is more visible than retention and easier to buy.
A small-business version
A business with fewer than a few hundred customers does not need a model. It needs a spreadsheet with each customer's first purchase date, total margin to date, and whether they are still active. From that come the three numbers that matter: what a typical customer has been worth so far, how long they tend to stay, and how those figures differ by where the customer came from. That is enough to set an acquisition budget and to notice when something changes. If you would like help connecting your website's acquisition numbers to what customers are actually worth, book a call.
Common questions
How do you calculate customer lifetime value?
For repeat purchases: average order value multiplied by orders per year, multiplied by years retained, multiplied by gross margin. For subscriptions: monthly gross margin per customer divided by monthly churn rate. Use margin, not revenue, and base lifespan on cohort data rather than current customers.
What is a good CLV to CAC ratio?
A common benchmark is at least 3:1, meaning a customer is worth three times what it cost to acquire them, with acquisition cost recovered within about twelve months. Below 1:1 every new customer loses money.
What is the difference between CLV and LTV?
Nothing. Customer lifetime value (CLV) and lifetime value (LTV) are the same metric under two abbreviations. Some writers use CLV for the historical figure and LTV for the forecast, but the usage is not consistent.
Should CLV use revenue or profit?
Profit, specifically gross margin. A customer who generates £10,000 of revenue at a 20 per cent margin is worth £2,000. Using revenue makes acquisition look far cheaper relative to value than it is.
How do you increase customer lifetime value?
Increase order value with tiers or bundles, increase purchase frequency, extend how long customers stay through better onboarding and support, and protect margin. For subscription businesses, reducing churn has the largest effect because lifetime value is inversely proportional to it.